Building performance metrics
[edit] Introduction
The mere act of assessing the operation of things tends to lead to improvements in performance. This is a useful by-product of any intervention. When it comes to building performance, assessments need to combine the physical and the behavioural, for example energy consumption and occupant satisfaction. The combination is vital. The I3CON research project seeks to go beyond the performance of individual factors and look at the total delivered value of the building to the customer.
Performance metrics for the operation and maintenance of buildings have not been agreed by either the construction industry or its clients. People tend to select those that are most appropriate for their situation.
So what does an organisation need to know to allow it to make informed property decisions? There are many metrics that need to be available about a facility before strategic property decisions can be made, such as life-cycle costs, functionality and lease agreements.
[edit] Choosing the right metrics
There is always a need in building operation and maintenance to provide a clear and compelling case for resources. Interventions must also be able to benefit an organisation’s corporate objectives. For example, organisations need to be convinced that proactive maintenance is in its best interest, and that the measurements (the metrics) verify that maintenance makes sense from a business perspective.
In March 2009, BSRIA held a focus group meeting to develop a set of metrics in consultation with industry stakeholders. The focus group considered the inter-relationship between measuring the performance of a building as an asset and measuring the value or effect of that measured attribute on the organisation. The aim was to identify the important metrics, as well as to gain an initial understanding of how building performance measurements varied according to the use of a building.
Inevitably, the user group’s range of perspectives made it difficult to draw firm conclusions from one meeting. However, the results were developed into an initial set of operating and management metrics. These were then tested by other industry representatives through a second workshop and a telephone survey.
The resulting metrics were grouped into seven key indicators:
- Building running costs.
- Reliability of the building and resilience to failure.
- Flexibility of the internal space.
- Building and systems complexity.
- Productivity of occupants.
- Contribution to corporate image.
- Environmental impact.
A telephone survey was undertaken to test these metrics on a larger sample of 28 building operators. Respondents were categorised into types of properties that they operated. The majority of operators (63 per cent) were running office buildings; 18 per cent were running manufacturing plants, and 7 per cent were running University properties.
When the respondents were asked which metrics they already use, the results were slightly different from those they thought important. There is a tendency to record the metrics that are easy to assess. Metrics that are difficult to assess, such as productivity, are rarely used.
Figure 1: The use of building performance metrics reported by the BSRIA survey. The results from the three building sectors have been aggregated to show the ranking of the metrics (hence the accumulated percentage axis). Each metric is, of itself, a percentage score of the ratio between use and importance.
BSRIA took the ratings for importance and frequency of use to generate a ratio of importance to use for each metric. This highlighted metrics that are not currently used but regarded as valuable in the future.
It is reasonable to assume that if effort is concentrated on the top five most under-utilised metrics, and workable methods are developed, the facilities management community will welcome them.
Of course, facilities managers do not all occupy similar premises or have the same needs. Hence the individual results for manufacturing, universities and offices are separated out in Figure1. This reveals that the three environmental measures are used by all of the universities, but to a lesser degree by manufacturing firms. Less than 40 per cent of respondents in offices were using environmental metrics.
User perceptions, through the use of post-occupancy evaluations or customer surveys, were less important for the office and manufacturing groups, but remain a priority for universities.
The least used measures which are not important to the universities and only of small importance to the offices and manufacturing groups are business impact from disruption, lifecycle costs, flexibility of support systems, remaining liability costs and occupant productivity.
The metric of total facilities management (FM) costs is used by a good percentage of the respondents in each group, although some universities and manufacturing respondents did not regarded the metric as an appropriate measure for their facilities.
While the survey results were interesting, the number of responses was too small for detailed analysis. The results are nonetheless a good indication that different performance metrics are needed for different types of building.
- Headline indicator
- Suggested metrics
- Building running costs
- Total facilities management cost per m2, workstation, or employee
- Building cost/business revenue ratio
- Lifecycle cost per m2, expressed as equivalent annual cost
- Remaining liability (£)
- Reliability of the building and resilience to failure
- Availability against plan
- Planned/reactive ratios
- The effect of disruption on a business
- Ease of maintenance for a range of typical maintenance activities
- Time to reinstate
- Flexibility of the internal space
- Time and cost to move a single member of staff/office/room, and reconfigure a group of desks
- Utilisation of space
- Flexibility of support systems
- Complexity of the building and its systems
- FM perception
- User perception
- Productivity of occupants
- Sick days/full-time equivalent
- Contribution to personal productivity
- Contribution to corporate image
- Design Quality Indicator (DQI) assessment – particularly the functionality and impact measures
- Desirability of location
- Environmental impact
- Carbon footprint
- Water footprint
- Energy use per m2 or per person
This article was originally written by Jo Harris and appeared in the March 2010 edition of BSRIA’s Delta T magazine. It has been posted here in a slightly modified form by BSRIA
BSRIA acknowledges the support of the European Commission and in particular its NMP programme for partly funding the I3CON project.
--BSRIA
[edit] Related articles on Designing Buildings Wiki
- 2021 Soft Landings Conference.
- BSRIA.
- Building performance.
- Building performance evaluation.
- Building performance evaluation in non-domestic buildings guide – an introduction to the tests and methods in non-domestic buildings.
- Building use studies (BUS).
- Co-heating test.
- Defects liability period.
- Design quality.
- Design quality indicator DQI.
- Energy performance certificates.
- Facilities management.
- Green building.
- Green rating systems.
- Maintenance.
- Migration strategy.
- NABERS UK.
- Performance in use.
- Post occupancy evaluation.
- Post project review.
- Quad Central in Malta aims for LEED Platinum certification.
- Soft landings.
Featured articles and news
Amendment to the GB Energy Bill welcomed by ECA
Move prevents nationally-owned energy company from investing in solar panels produced by modern slavery.
Gregor Harvie argues that AI is state-sanctioned theft of IP.
Heat pumps, vehicle chargers and heating appliances must be sold with smart functionality.
Experimental AI housing target help for councils
Experimental AI could help councils meet housing targets by digitising records.
New-style degrees set for reformed ARB accreditation
Following the ARB Tomorrow's Architects competency outcomes for Architects.
BSRIA Occupant Wellbeing survey BOW
Occupant satisfaction and wellbeing tool inc. physical environment, indoor facilities, functionality and accessibility.
Preserving, waterproofing and decorating buildings.
Many resources for visitors aswell as new features for members.
Using technology to empower communities
The Community data platform; capturing the DNA of a place and fostering participation, for better design.
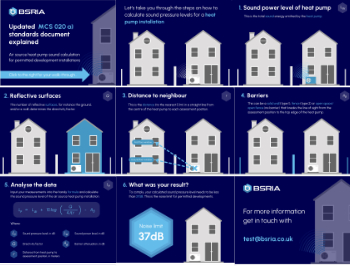
Heat pump and wind turbine sound calculations for PDRs
MCS publish updated sound calculation standards for permitted development installations.
Homes England creates largest housing-led site in the North
Successful, 34 hectare land acquisition with the residential allocation now completed.
Scottish apprenticeship training proposals
General support although better accountability and transparency is sought.
The history of building regulations
A story of belated action in response to crisis.
Moisture, fire safety and emerging trends in living walls
How wet is your wall?
Current policy explained and newly published consultation by the UK and Welsh Governments.
British architecture 1919–39. Book review.
Conservation of listed prefabs in Moseley.
Energy industry calls for urgent reform.


